 |
Picture by Andrew Sharpe ©
|
 |
|
|
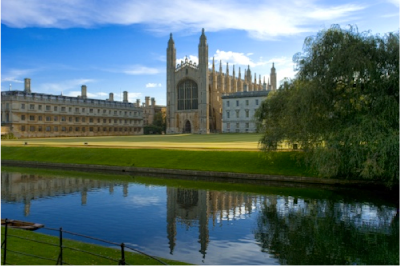
Cambridge is located about fifty miles northeast of London and is famous for being the home of the University of Cambridge. It is situated in the region of East Anglia in eastern England. The city has two weather observing stations: the National Institute of Agricultural Botany (NIAB) and the University of Cambridge Botanical Garden.
Below is a graph of the average monthly temperature, both the average high and the average low, as well as the average high and low extremes. The highest temperatures are seen in July and August while the lowest temperatures are seen in January and February. The average temperature ranges from about 1°C in winter to about 24°C in the summer months.
 |
Below is a graph of the average monthly rainfall in Cambridge. The amount of rainfall Cambridge receives is fairly consistent throughout the year. Eastern England is typically drier than the rest of the country with February being Cambridge's driest month. Increased temperatures in the summer months sometimes lead to higher amounts of rainfall, as is demonstrated by June being the city's wettest month.
 | ||||||||||||||||||||||||||||||||||||||||||||||||||||||||||||||||||||||||||||||||||||||||||||||||||||||||||||||||
|
Below is a table that contains the average high, average low, record high, record low, and average monthly precipitation in Cambridge.
| ||||||||||||||||||||||||||||||||||||||||||||||||||||||||||||||||||||||||||||||||||||||||||||||||||||||||||||||||
Cambridge's climate is largely dictated by the Gulf Stream. As the temperature of the ocean changes, the climate of Cambridge changes accordingly. For example, the temperature of the sea has a profound impact on the atmospheric humidity of Cambridge and, consequently, affects the amount of rainfall received. Because the gulf stream brings warmer water to the coast of the U.K., Cambridge experiences temperatures that are higher than those typically seen in areas at such a high northern latitude. This also means that temperatures don't vary quite as dramatically throughout the different seasons.
Bowen Ratio:
The average Bowen Ratio of Europe is 0.62 while the Bowen Ration for the oceans is about 0.11. The more moist a region is, the lower the Bowen Ratio is. Since Cambridge lies relatively near the coast and receives an average of 560mm of precipitation a year, its Bowen Ratio would be reasonably low. Cambridge, however, is still not as moist as other areas of the United Kingdom and as such would have a comparatively higher Bowen Ratio. As a result, I think Cambridge would have a Bowen Ratio of approximately 0.6 < 1. According to this ratio, Cambridge has a maritime climate.
GEEBIT Exercise:
Average Surface Temperature using given values of Albedo = 0.306 and Greenhouse Factor = 1.00:
K
|
°C
|
°F
|
|
Average
Surface Temperature
|
288.1
|
15.0
|
58.9
|
A.)
Average Surface Temperature using Albedo = 0.406 and Greenhouse Factor = 1.00:
K
|
°C
|
°F
|
|
Average
Surface Temperature
|
277.1
|
4.0
|
39.1
|
Average Surface Temperature using Albedo = 0.206 and Greenhouse Factor = 1.00:
K
|
°C
|
°F
|
|
Average
Surface Temperature
|
298.0
|
24.8
|
76.7
|
B.)
Average Surface Temperature using Albedo = 0.306 and Greenhouse Factor = 1.1:
K
|
°C
|
°F
|
|
Average
Surface Temperature
|
290.9
|
17.7
|
63.9
|
Average Surface Temperature using Albedo = 0.306 and Greenhouse Factor = 0.9:
K
|
°C
|
°F
|
|
Average
Surface Temperature
|
285.2
|
12.1
|
53.8
|
C.) The average global surface temperature increased dramatically with decreased albedo and with a higher greenhouse factor. If the average global temperature increased, Cambridge would have a wetter climate because the increased temperature of the ocean would increase the amount of precipitation in the city. The average global surface temperature decreased significantly with increased albedo and with a lower greenhouse factor. A lower surface temperature would result in Cambridge being drier and would impact the region's ability to serve as an agricultural center for England. Currently, farming is an important enterprise in East Anglia and an overall higher temperature and drier climate would make farming in and around Cambridge difficult.
Since Cambridge's climate is, in large part, controlled by the ocean and the Gulf Stream, any major changes in ocean temperatures would have a significant influence on the city's weather. Colder ocean temperatures would probably result in a less temperate climate and more dramatic temperature swings in Cambridge throughout the year while warmer ocean temperatures would probably result in a more moist climate.
No comments:
Post a Comment