Wednesday, May 9, 2012

Final Blog Post

Source: http://www.picturesofengland.com/England/Cambridgeshire/Cambridge/pictures/1130632

Cambridge is located in the region of the United Kingdom called East Anglia or East of England. A lot of research has been done regarding how this region will be affected if we continue to see climate changes due to global warming. 

Temperature projections:


Source: http://www.ukcip.org.uk/uk-impacts/uk-maps/maps/temperature/

Precipitation projections:

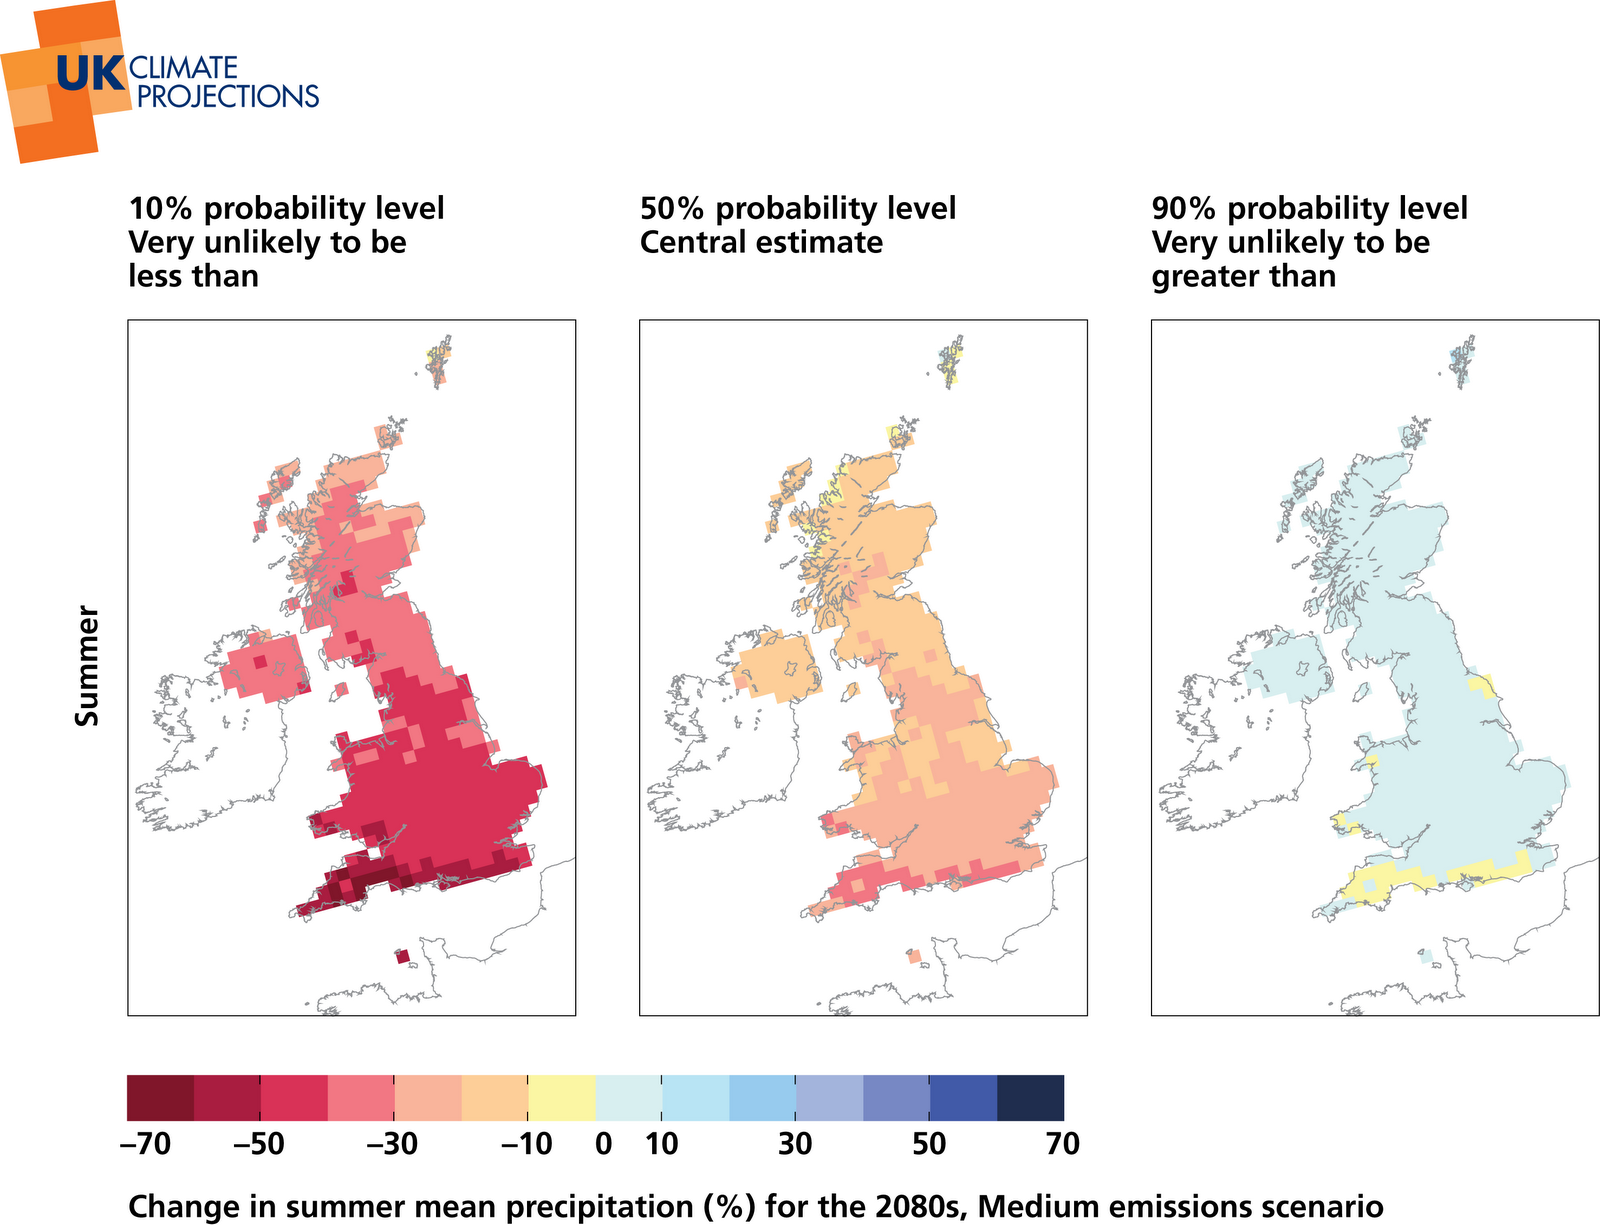
Source: http://www.ukcip.org.uk/uk-impacts/uk-maps/maps/precipitation/


For Cambridge, it has been estimated that over the next seventy years the average winter temperature will increase by about 3°C and the possible range is anywhere from 1.6°C to 4.7°C. It has also been estimated that over the next seventy years the average summer temperature will increase approximately 3.6°C and the possible range is anywhere from 1.9°C to 5.9°C. When it comes to precipitation, it is expected that by 2080 the average amount of winter precipitation will increase by about 20% and the possible range is from 4% to 44%. It is also projected that by 2080 the average amount of summer precipitation will decrease by approximately 21% and the possible range is anywhere from decreasing by 45% to increasing by 6%.

It is expected for Cambridge and the surrounding region to become warmer and drier if current trends continue. Increasing temperatures and a greater decrease in summer precipitation than an increase in winter precipitation will result in a more arid climate. 

The majority of Cambridge lies below 60m above sea level, leaving the area at risk of being affected by rising sea levels in the distant future. The East Anglia region is sinking due to geologic processes which increases its vulnerability to coastal flooding. Cambridge is located far enough away from the coast, however, that it most likely won't be affected by the slight sea level rise expected to occur over the coming decades. Cambridge is situated in one of the drier regions of the United Kingdom and, as such, is more vulnerable to water shortages and heat waves as the local climate becomes warmer and drier over all. On the other hand, increased precipitation during winter months could result in increased risks of flooding in local rivers. The River Cam runs directly through the city of Cambridge and could become more of a flooding hazard with the increased winter precipitation and with the increased number of extreme rainfall events being experienced during winter months.


While the East Anglia region is mostly rural, Cambridge is one of the more developed portions of the area. The economy of Cambridge, however, is still somewhat reliant on the agricultural industry of the region. The projected climate changes are expected to have a great impact on the large amount of local land used for agriculture. Increasing temperatures and less water available during summer months for agricultural use will impede the region's ability to produce food. Luckily, Cambridge is one of the fastest growing cities within the region and will most likely be able to rely on the local university, the growing local economy, and its increasingly developing city even if the local agricultural industry suffers due to the changing climate.

Cambridge is a prime location for tourism due to its proximity to both London and the east cost of England. Rising sea levels impacting the coast could have a negative impact on the tourism sector of Cambridge's economy.

Mitigation:

The increased risk of extreme rainfall events and subsequent flooding during winters in Cambridge means that the city has begun developing better warning systems so as to ensure the safety of local residents in the event of these storms and disasters. The increased risk of flooding also means that more attention needs to be paid to flood-proofing the new houses and buildings being constructed in the ever-growing city of Cambridge. Houses that are currently located in the flood plain need to be adapted so they are more prepared to withstand a flood.

Source:http://www.ilankelman.org/floodphotos.html


The altered temperatures Cambridge is anticipating are going to have a significant impact on the demand for water within the city. Warmer temperatures in the summertime are going to increase the demand for water during a time when less water is available. So, in order to compensate for that, the city of Cambridge should devise an efficient system to collect and store the increased amount of water expected during wintertime for use during peak demand times throughout the rest of the year. In addition to modifying demand for water, the warmer temperatures will change the year-round energy demand throughout the city. There will be increased demand during summer because of increased air conditioner use and there will be less demand during winter because less energy will be required for heating. In order to mitigate this change in energy demand, Cambridge could invest in developing local renewable energy sources such as wind and solar power. If local business and residents utilize more renewable energy sources, they will have more control over their energy usage which will lessen the strain on the major energy providers.

The agricultural industry around Cambridge will be greatly affected by upcoming climate changes. Growing crops will become more of a challenge due to less water in the soil and the altered growing season. The warmer temperatures will create an environment more conducive to pests and, as a result farmers should start looking into new and improved pesticides to avoid massive crop damage. Of course, increased use of pesticides could prove to be the cause of different heath problems for local residents. Farmers should also begin looking into drought-resistant crop varieties now. If farmers begin to take action now, they can avoid costly economic consequences in the future.

Since Cambridge is one of the fastest growing cities within East Anglia, it is vital that developers begin considering the warmer and drier climate expected to become the norm when designing plans for things such as buildings, road systems, waste management systems, and nature conservation. The city should also look into educating local residents on how they can contribute to the effort of adapting to the warmer and drier climate. For example, they could teach residents how to conserve water, save energy, and remain safe during extreme weather events such as heat waves. 

References:
[1] - "Living with Climate Change in East of England." <http://www.ukcip.org.uk/wordpress/wp-content/PDFs/EoE_summary.pdf>


Wednesday, May 2, 2012

Blog Post #3

Source:http://en.wikipedia.org/wiki/File:Uk_topo_en.jpg


Climate Controls:

Meso-scale: Cambridge itself is located in a flat portion of the British Isle but it climate is affected by the more mountainous and hilly western section of the island. As I've mentioned in previous blog posts, Cambridge experiences a slight rain shadow effect because of these mountains and, as a result, receives less rainfall than the majority of the United Kingdom. Cambridge's climate is hugely impacted by the city's proximity to the Atlantic ocean and the Gulf Stream. As the temperature of the nearby ocean changes, the temperature of Cambridge fluctuates as well. The temperature of the sea dictates the atmospheric humidity of the city which, in turn, affects the amount of rainfall received. The Gulf Stream brings warmer water to the eastern side of the island, so Cambridge's temperature is higher than that usually seen in areas so far north. The presence of the Gulf Stream also results in less variance between the seasons in Cambridge. The River Cam flows through Cambridge but it has little to no effect on the local weather. Cambridge is not subject to severe weather such as tornadoes or hurricanes. 

Micro-scale: Cambridge is situated approximately 50 miles northeast of London so any urban heat island effect suffered by London to not extend far enough to have a major impact on Cambridge's climate. Cambridge is a city but it is not as urban as London and is not an industrial city. It's a University town and, as such, it doesn't produce any great urban heat island effects. The main weather station is located within the University of Cambridge and is in the western side of town.

Source: http://www.cl.cam.ac.uk/research/dtg/weather/map.html

Since the weather station is not situated within the center of town, the effects from smog are minimal or even zero.

Historical Temperature Trends:

 Data Source: http://www.cl.cam.ac.uk/research/dtg/weather/index-period-text.html

The data for the weather station at the University of Cambridge goes back to 1995 and the above graph shows the average, maximum, and minimum temperatures for January recorded in the city since then. Over the past sixteen years, January temperatures in Cambridge have experienced a slight increase but have since returned to previous averages. It appears that 2002 - 2004 were about the time when January temperatures were at their highest point and now the average temperatures seem to be on a cooling trend. The average, maximum, and minimum temperatures all seem to be following the same trends for temperatures record in January.


Data Source: http://www.cl.cam.ac.uk/research/dtg/weather/index-period-text.html


The above graph shows the average, maximum, and minimum temperatures for Cambridge in July over the past sixteen years. The patterns on this graph are not as clear and concise as on the graph for January temperatures. The average July temperature seems to have been fairly consistent over time with the slight exception of some cooling over the past four years or so. The average minimum July temperatures experienced a small decrease between 1990 and 2006 but have remained fairly static since then. The average maximum temperatures increased slightly between 1996 and 2001 but have seen a substantial decrease since 2001.

Koppen-Geiger Classification System:


Source:http://www.srh.noaa.gov/jetstream/global/climate_max.htm


According to the Koppen-Geiger classification system, Cambridge is in the Cfb category. This means that it has a temperate climate, is wet year round, and has warm summers. It is mild with no dry season and the average temperature of all months is lower that 22°C. There are one to three months where the average temperature is over 50°C and rainfall is consistent throughout the year.


Climograph (In Two Pieces):


Tuesday, April 17, 2012

Reflection #1

Source: http://travel.yahoo.com/p-travelguide-191502077-lima_vacations-i

Source: http://www.trekearth.com/gallery/Europe/United_Kingdom/England/Cambridgeshire/Cambridge/photo39353.htm

For the first reflection assignment, I will compare the weather and climate of Cambridge, England with that of Lima, Peru. Cambridge has a maritime climate while Lima a subtropical and desert climate. Lima has consistently mild weather throughout the year and receives little rainfall. The average low temperature in Lima is between 12°C and 18°C and the average high temperature in Lima is between 24°C and 28°C. Humidity within Lima is high and produces fast-dissipating morning fogs from December to April and continuous low-lying clouds and mist from May to November. Summers (Dec. to Apr.) in Peru's capital are warm and moist while winters (May to Nov.) are cool, damp, and cloudy. Lima is located on the coast of Peru, in the arid plains region to the west of the Andes mountains. A cold current, called the Humboldt current, travels along the coast of Peru and moderates the heat of Lima while also providing humidity and mist. The Andes mountains located to the east of Lima protect the capital city from the tropical climate and the storms formed in the Amazon Basin.

Average Temperature, Humidity, and Rainfall of Lima:

Source: http://www.limaeasy.com/lima_info/weather_in_lima_peru.php


Like Cambridge, Lima's climate is affected by nearby mountains. Both cities receive less rain than expected in their respective locations because local mountain ranges protect them from precipitation that is affecting nearby areas. Cambridge, however, receives significantly more rain annually than does Lima. Since both cities are near the ocean, their weather is impacted by currents running along the coasts. Cambridge's weather is largely dictated by the Gulf Stream while Lima's weather is dictated by the Humboldt Current. Though the Gulf Stream is a warm-water current and the Humboldt Current is a cold-water current, they both have the same effect on the two cities: the currents result in a more mild and consistent climate than is expected for the cities' locations. As a result, Lima has a cooler climate than would be expected and Cambridge has a warmer climate than would be expected. One major difference between the climate of Cambridge and that of Lima is the effect of El Niño. While Cambridge does not feel the impacts of an El Niño year, Lima experiences more rain than normal. 

Lima experiences only two seasons, winter and summer, while Cambridge enjoys the full spectrum of all four seasons. Because Lima is in the southern hemisphere, its seasons are reversed when compared to those of Cambridge. Winter in Lima occurs from May to November and summer occurs from December to April. So, while Cambridge is enjoying warm and clear summer days, Lima is trudging through an overcast and damp winter.


Thursday, April 5, 2012

Blog Post #2

 Source: http://www.weatheronline.co.uk/reports/wxfacts/Air-masses-and-their-sources.htm

The United Kingdom, including Cambridge, is affected by five air masses: mT, cT, mP, cP, and A. In addition, it is affected by what is called Returning mP which is polar air that has moved south over the ocean and then returned northward to approach the U.K. from the south.

The Tropical Continental air mass originates in North Africa and approaches the U.K. from the southeast. This air tends to be dry and brings hot temperatures accompanied by clear skies in the summer. Sometimes, the air picks up moisture as it travels over the Mediterranean Sea and can result in thunderstorms.

The Tropical Maritime air mass originates in the subtropical Atlantic Ocean and approaches the U.K. from the southwest. While the air cools on its journey over the ocean, it loses little moisture. Thus, when it reaches the U.K. it brings warm, wet and overcast weather. In the summer, the clouds over Cambridge often burn off and the result is warmer and drier weather.

The Maritime Polar air originates over the Canadian arctic or the Greenland region and reaches the British Isles from the west or northwest. As the cold air mass travels over the ocean, it warms up from below and becomes unstable. Thus, the polar maritime air brings cool, moist air accompanied by rain and showers. Because Cambridge is sheltered by the Scottish and Welsh mountains, however, it remains drier than the rest of the island. In the spring and summer, the clouds heat up during the day. This results in showers and thunderstorms that can occur anywhere, including Cambridge. In winter, the showers are generally limited to the west coast.

The Arctic air mass generally only affects the U.K. in winter and is colder and drier than the Maritime Polar air. As it moves toward the British Isles, it accumulates enough moisture to generate sleet and snow. Cambridge is far enough south that it is usually not impacted by these showers and instead experiences cold weather with clear skies.

The Polar Continental air originates in Scandinavia or Russia and approaches the U.K. from the east or northeast. These air masses usually only affect the island during winter. This air causes below average temperatures in winter and above average temperatures in summer. The air is generally dry, resulting in fine and sunny weather. If the air mass passes over the North Sea between Denmark and Scotland, it gathers more moisture and brings cloudy weather to Cambridge, sometimes accompanied by drizzle or light snow.

Forecast for April 5, 2012 - April 8, 2012:


Source: http://www.metoffice.gov.uk/weather/uk/uk_forecast_pressure.html
Pressure chart symbols
Cold front
Cold front
The leading edge of an advancing colder air mass. Its passage is usually marked by cloud and precipitation, followed by a drop in temperature and/or humidity.
Warm front
Warm front
The leading edge of an advancing warmer air mass, the passage of which commonly brings cloud and precipitation followed by increasing temperature and/or humidity.
Occluded front
Occluded front (or 'occlusion')
Occlusions form when the cold front of a depression catches up with the warm front, lifting the warm air between the fronts into a narrow wedge above the surface. Occluded fronts bring cloud and precipitation.
Developing cold frontDeveloping warm front
Developing cold/warm front (frontogenesis)
Represents a front that is forming due to increase in temperature gradient at the surface.
Weakening cold front Weakening warm front
Weakening cold/warm front (frontolysis)
Represents a front that is losing its identity, usually due to rising pressure. Cloud and precipitation becomes increasingly fragmented.
 Source: http://www.metoffice.gov.uk/weather/uk/uk_forecast_pressure.html

Cambridge is affected by cold fronts, arm fronts, and occluded fronts. By Saturday April 7, a warm front will have passed through Cambridge from the northwest, followed by a cold front approaching from the northeast. That cold front will then be followed by another warm front coming from the northwest by Sunday April 8. For Friday April 6 and Saturday April 7, Cambridge is expecting cloudy skies with relatively good visibility. By Sunday, however, there will be showers brought on by the arrival of the second warm front.

Cambridge lies in the eastern plains of England on the lee side of the Scottish and Welsh mountains. Since the maritime air masses approach the U.K. from the west and the continental air masses approach the U.K. from the east, Cambridge is typically drier than the majority of the island. The wetter air of the maritime air masses must pass over the mountains before reaching Cambridge, causing a slight rain shadow effect, while the drier air of the continental air masses approaches Cambridge directly. In general, Cambridge doesn't experience severe weather such as hurricanes or tornadoes. Instead, the weather remains fairly consistent throughout the year.


References:

http://www.metlink.org/weather-climate-resources-teachers/key-stages-weather-climate/key-stage-4-weather/ks4-airmasses-2.html


Thursday, March 8, 2012

Blog Post #1

Picture by Andrew Sharpe ©


Cambridge is located about fifty miles northeast of London and is famous for being the home of the University of Cambridge. It is situated in the region of East Anglia in eastern England. The city has two weather observing stations: the National Institute of Agricultural Botany (NIAB) and the University of Cambridge Botanical Garden.

Below is a graph of the average monthly temperature, both the average high and the average low, as well as the average high and low extremes. The highest temperatures are seen in July and August while the lowest temperatures are seen in January and February. The average temperature ranges from about 1°C in winter to about 24°C in the summer months.


Below is a graph of the average monthly rainfall in Cambridge. The amount of rainfall Cambridge receives is fairly consistent throughout the year. Eastern England is typically drier than the rest of the country with February being Cambridge's driest month. Increased temperatures in the summer months sometimes lead to higher amounts of rainfall, as is demonstrated by June being the city's wettest month.


Below is a table that contains the average high, average low, record high, record low, and average monthly precipitation in Cambridge.

Climate data for Cambridge University Botanic Garden, elevation 12m,1971–2000, extremes 1914–
Month
Jan
Feb
Mar
Apr
May
Jun
Jul
Aug
Sep
Oct
Nov
Dec
Year
Record high °C (°F)
14.9
(58.8)
18.8
(65.8)
23.9
(75.0)
26.1
(79.0)
31.1
(88.0)
34.0
(93.2)
35.6
(96.1)
36.9
(98.4)
33.9
(93.0)
29.3
(84.7)
21.1
(70.0)
15.8
(60.4)
36.9
(98.4)
Average high °C (°F)
7.0
(44.6)
7.6
(45.7)
10.4
(50.7)
13.0
(55.4)
16.9
(62.4)
19.8
(67.6)
22.6
(72.7)
22.5
(72.5)
19.1
(66.4)
14.9
(58.8)
10.1
(50.2)
7.9
(46.2)
14.3
(57.7)
Average low °C (°F)
1.2
(34.2)
0.9
(33.6)
2.7
(36.9)
4.0
(39.2)
6.8
(44.2)
9.7
(49.5)
11.9
(53.4)
11.8
(53.2)
9.7
(49.5)
6.8
(44.2)
3.5
(38.3)
2.1
(35.8)
6.0
(42.8)
Record low °C (°F)
−16.1
(3.0)
−17.2
(1.0)
−11.7
(10.9)
−6.1
(21.0)
−4.4
(24.1)
−0.6
(30.9)
2.2
(36.0)
3.3
(37.9)
−2.2
(28.0)
−6.1
(21.0)
−13.3
(8.1)
−15.6
(3.9)
−17.2
(1.0)
Precipitation mm (inches)
44.79
(1.7634)
32.56
(1.2819)
41.72
(1.6425)
42.44
(1.6709)
45.03
(1.7728)
53.70
(2.1142)
41.85
(1.6476)
48.46
(1.9079)
53.34
(2.1)
54.35
(2.1398)
51.39
(2.0232)
50.31
(1.9807)
559.94
(22.0449)
Source: KNMI - http://eca.knmi.nl/utils/mapserver/climatology.php?indexcat=**&indexid=**&periodidselect=1971-2000&seasonid=0&scalelogidselect=no&minx=-461428.571429&miny=-4727380.952381&maxx=405238.095239&maxy=-
4077380.952380&MapSize=560%2C420&imagewidth=560&imageheight=420&CMD=QUERY_POINT&CMD=QUERY_POINT#bottom

Cambridge is located in a relatively flat and low-lying area and has a maritime climate. The majority of the East Anglia region is below 200 feet and is situated to the east of the more mountainous and hilly portion of the United Kingdom. Because Cambridge is part of the coastal plains of eastern england, it experiences a slight rain shadow effect. Before rain clouds reach Cambridge, they first have to pass over Ireland and the more mountainous western portion of the United Kingdom. This results in Cambridge, and the rest of the East Anglia region, receiving less precipitation (both rain and snow) than the rest of the country. The yearly average precipitation in Cambridge is about 560mm (22in) while the national average is about 840mm (33in). Cambridge also tends to have higher temperatures than the national average.

Cambridge's climate is largely dictated by the Gulf Stream. As the temperature of the ocean changes, the climate of Cambridge changes accordingly. For example, the temperature of the sea has a profound impact on the atmospheric humidity of Cambridge and, consequently, affects the amount of rainfall received. Because the gulf stream brings warmer water to the coast of the U.K., Cambridge experiences temperatures that are higher than those typically seen in areas at such a high northern latitude. This also means that temperatures don't vary quite as dramatically throughout the different seasons.

Bowen Ratio:

The average Bowen Ratio of Europe is 0.62 while the Bowen Ration for the oceans is about 0.11. The more moist a region is, the lower the Bowen Ratio is. Since Cambridge lies relatively near the coast and receives an average of 560mm of precipitation a year, its Bowen Ratio would be reasonably low. Cambridge, however, is still not as moist as other areas of the United Kingdom and as such would have a comparatively higher Bowen Ratio. As a result, I think Cambridge would have a Bowen Ratio of approximately 0.6 < 1. According to this ratio, Cambridge has a maritime climate.

GEEBIT Exercise:


Average Surface Temperature using given values of Albedo = 0.306 and Greenhouse Factor = 1.00:


K
°C
°F
Average Surface Temperature
288.1
15.0
58.9


A.)

Average Surface Temperature using Albedo = 0.406 and Greenhouse Factor = 1.00:


K
°C
°F
Average Surface Temperature
277.1
4.0
39.1


Average Surface Temperature using Albedo = 0.206 and Greenhouse Factor = 1.00:


K
°C
°F
Average Surface Temperature
298.0
24.8
76.7


B.)

Average Surface Temperature using Albedo = 0.306 and Greenhouse Factor = 1.1:


K
°C
°F
Average Surface Temperature
290.9
17.7
63.9


Average Surface Temperature using Albedo = 0.306 and Greenhouse Factor = 0.9:


K
°C
°F
Average Surface Temperature
285.2
12.1
53.8


C.) The average global surface temperature increased dramatically with decreased albedo and with a higher greenhouse factor. If the average global temperature increased, Cambridge would have a wetter climate because the increased temperature of the ocean would increase the amount of precipitation in the city. The average global surface temperature decreased significantly with increased albedo and with a lower greenhouse factor. A lower surface temperature would result in Cambridge being drier and would impact the region's ability to serve as an agricultural center for England. Currently, farming is an important enterprise in East Anglia and an overall higher temperature and drier climate would make farming in and around Cambridge difficult. 

Since Cambridge's climate is, in large part, controlled by the ocean and the Gulf Stream, any major changes in ocean temperatures would have a significant influence on the city's weather. Colder ocean temperatures would probably result in a less temperate climate and more dramatic temperature swings in Cambridge throughout the year while warmer ocean temperatures would probably result in a more moist climate.